11 essential candlestick patterns
Whether you’re a new trader or an experienced portfolio manager looking to brush up on your candlestick chart reading skills, this guide will give you a clear overview and explain some of the main candlestick patterns to look out for.
The history of candlestick charts
Candlestick charts are among the most widely used financial charts for technical analysis. Western traders adopted them following the publication of Steve Nison’s Japanese Candlestick Charting Techniques in 1991. However, they’re based on a system developed in Japan in the 1700s by Munehisa Homma, a merchant who wanted to predict changes in the price of rice.
In Alan Northcott’s The Complete Guide to Using Candlestick Charting, he describes candlestick charts as the ”embodiment of the emotions of fear and greed, which are felt by all traders”. The power of using candlestick charts and patterns is that they reveal more than simply prices—they provide insight into the psychology of traders in the market.
Although attempts have been made to determine the reliability of using candlestick patterns to predict price movements, they’re considered most powerful when used in tandem with other tools and analysis, such as real-time trading alerts.
Let’s start off by covering a few fundamentals.
What is a candlestick chart?
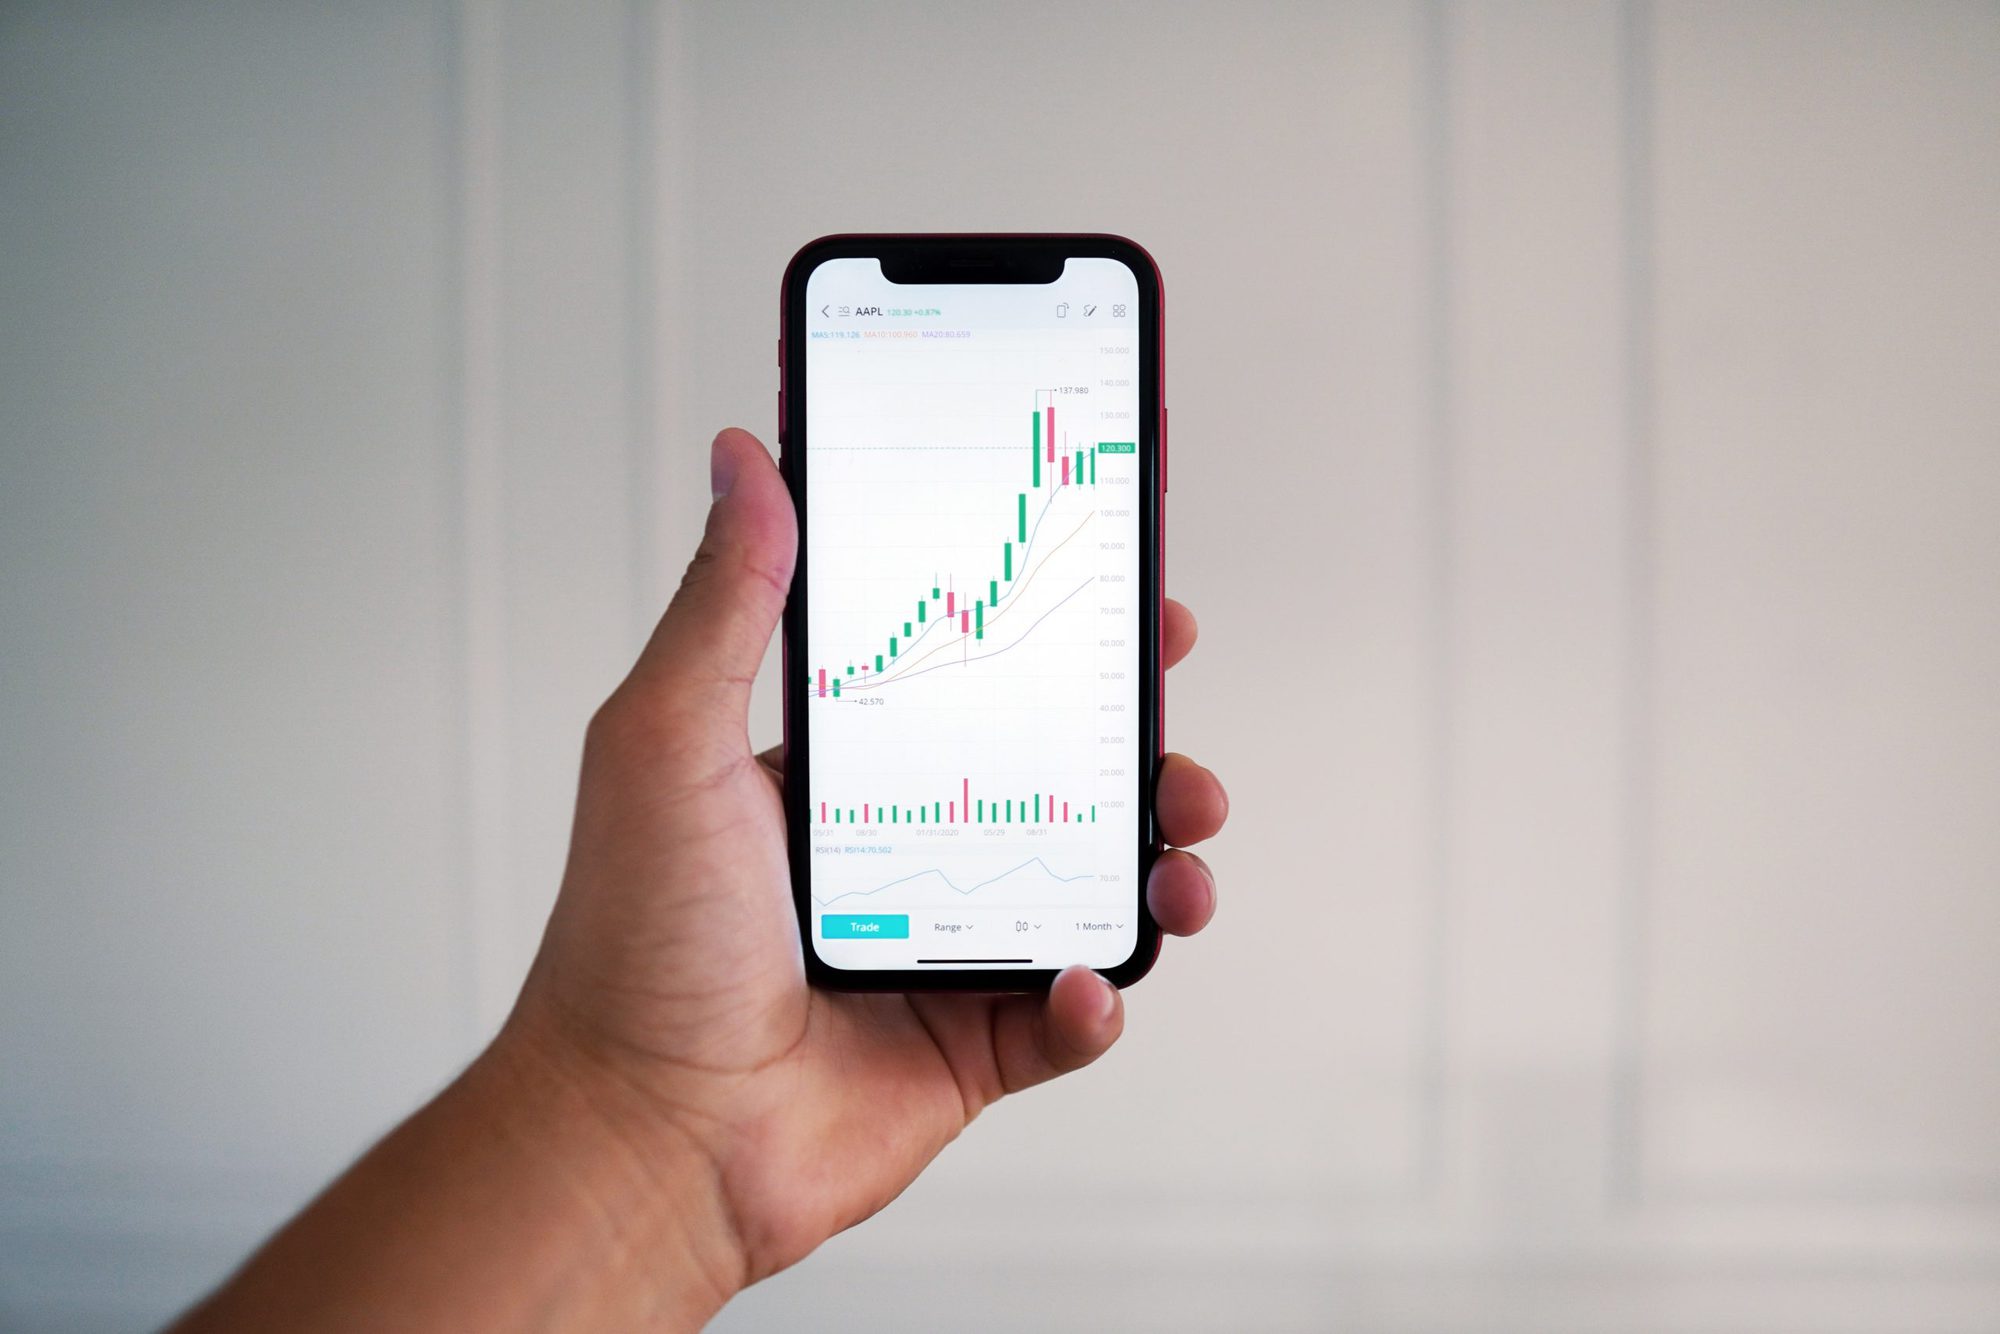
A candlestick chart is a visualization tool widely used by traders for technical analysis. Each trading period (whether that’s five minutes or a day) is represented by a candlestick (or candle) that shows the relative positions of four price points for that period: the high price, the low price, the opening price, and the closing price.
To show this, each candlestick comprises a ‘real body’ and a ‘shadow’ (or ‘wick’):
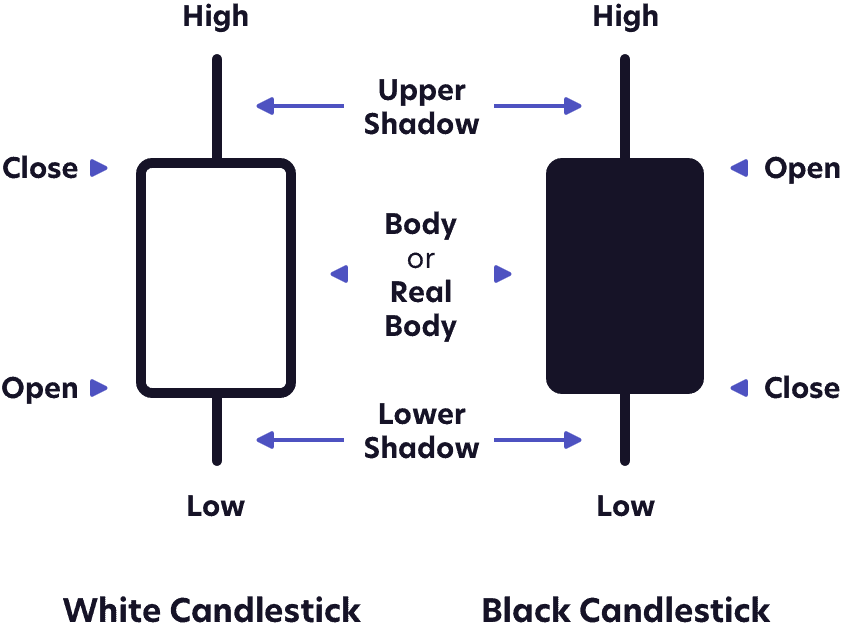
Changes in the length of the real body and the upper and lower shadows reveal the price action and give an insight into the emotion in the market.
Bullish, or ‘up’, candlesticks are usually green or white. Bearish, or ‘down’, candles are usually red or black.
What are candlestick patterns?
Traders such as Thomas Bulkowski have analyzed candlestick charts and identified recurring patterns, which they look for so they can forecast similar outcomes they can take advantage of. As with all technical analysis, the greatest opportunities arise when you can spot these patterns early and when they contradict the prevailing mood of the market or fundamental analysis.
Candlestick patterns may indicate the continuation of a trend or a reversal of a trend in the market (either bullish or bearish).
Below are some of the most common patterns.
Single-candle patterns
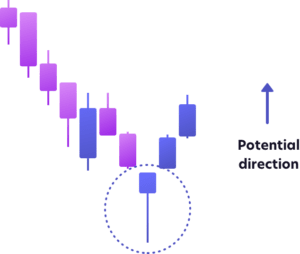
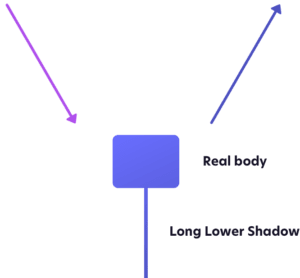
Hammer
Expected trend: Bullish
Type: Reversal
Look for: A single candle with a short real body, a long lower shadow, and little or no upper shadow, following a downward pattern.
What it means: Sellers have been driving the price down, but buyers have entered the market to drive the price up to above the opening price.
Hanging man

Expected trend: Bearish
Type: Reversal
Look for: A single candle with a short real body, a long lower shadow, and little or no upper shadow, following an upward trend.
What it means: Following a trend of buyers pushing the price up, in this period sellers have driven the price down from where they opened – buyers have come back in but were unable to push prices back up beyond levels seen in the previous period. This pattern often signals the end of the uptrend and a new downtrend.
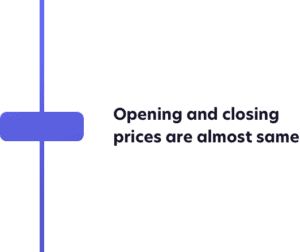
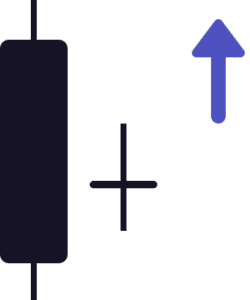
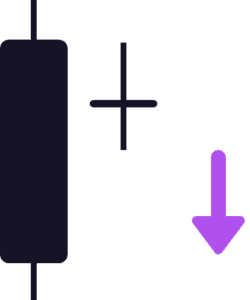
Doji
Expected trend: Bullish or bearish
Type: Continuation
Look for: A single candle with long upper and lower shadows and a real body that is very small or looks like a cross, meaning the opening and closing prices are the same or very nearly the same.
What it means: Indecision – neither buyers nor sellers are taking over.
Two-candle patterns
Engulfing (bullish)
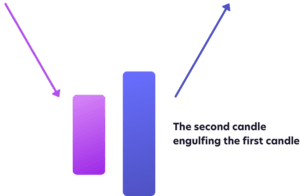
Expected trend: Bullish
Type: Reversal
Look for: Two candles: a bearish one followed by a bullish one that ‘engulfs’ the first one, following a downward trend.
What it means: Buyers are outnumbering sellers, and strong buying pressure is reversing the prevailing downward trend.
Harami (bullish)
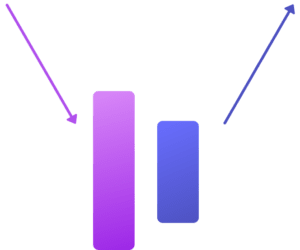
Expected trend: Bullish
Type: Reversal
Look for: Two candles: a long bearish one, and a short bullish one within the real body of the first candle, following a downward trend.
What it means: Buyers are back in the market, halting the downtrend and exerting upward pressure.
Harami cross (bullish)
Expected trend: Bullish
Type: Reversal
Look for: Two candles: a long bearish one, and a doji within the real body of the first candle, following a downward trend.
What it means: An indication of indecision and that buyers may be back in the market, halting the downtrend. Confirmation through a subsequent bullish candle will often lead to a new upward trend.
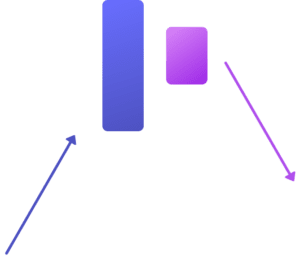
Engulfing (bearish)
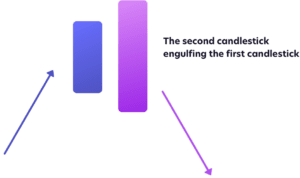
Expected trend: Bearish
Type: Reversal
Look for: Two candles: a bullish one followed by a bearish one that ‘engulfs’ the first one, following an upward trend.
What it means: Sellers have seized momentum and prices could be driven down further.
Harami (bearish)
Expected trend: Bearish
Type: Reversal
Look for: Two candles: a long bullish one, and a short bearish one within the real body of the first candle, following an upward trend.
What it means: Sellers are back in the market, halting the uptrend and exerting downward pressure.
Harami cross (bearish)
Expected trend: Bearish
Type: Reversal
Look for: Two candles: a long bullish one, and a doji within the real body of the first candle, following an upward trend.
What it means: An indication of indecision and that sellers may be back in the market, halting the uptrend. Confirmation through a subsequent bearish candle will often lead to a new downward trend.
Three-candle patterns
Morning star
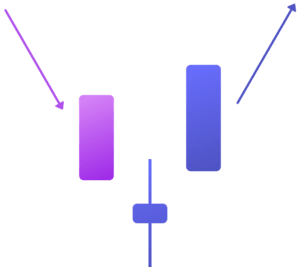
Expected trend: Bullish
Type: Reversal
Look for: Three candlesticks: a bearish one that gaps down to a doji, which then gaps up to a bullish one.
What it means: Sellers have been causing the price to fall, but this trend meets first indecision (signaled by the doji candle), and then upward pressure as buyers come back into the market.
Evening star
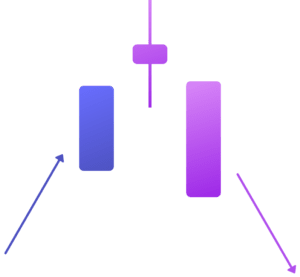
Expected trend: Bearish
Type: Reversal
Look for: Three candlesticks: a bullish one that gaps up to a doji, which then gaps down to a bearish one.
What it means: Buyers have been pushing up the price but meet resistance. The trend meets first indecision (signaled by the doji candle), and then downward pressure as sellers come back into the market.
Identify patterns early with the right tools and data
At United Fintech, we bring you the best fintech tools, products, and solutions—all in one place.
NetDania offers a first-class financial charting tool that displays live forex charts with more than 2,100 currency pairs as well as thousands of stocks, indices, and commodities.
You can book a free demo with one of our experts here, or find out how you can use our tools to identify trading opportunities here.


Heading
We turn bold ideas into measurable results. By combining insight, execution, and technology, we deliver solutions that make transformation not just achievable, but repeatable.


