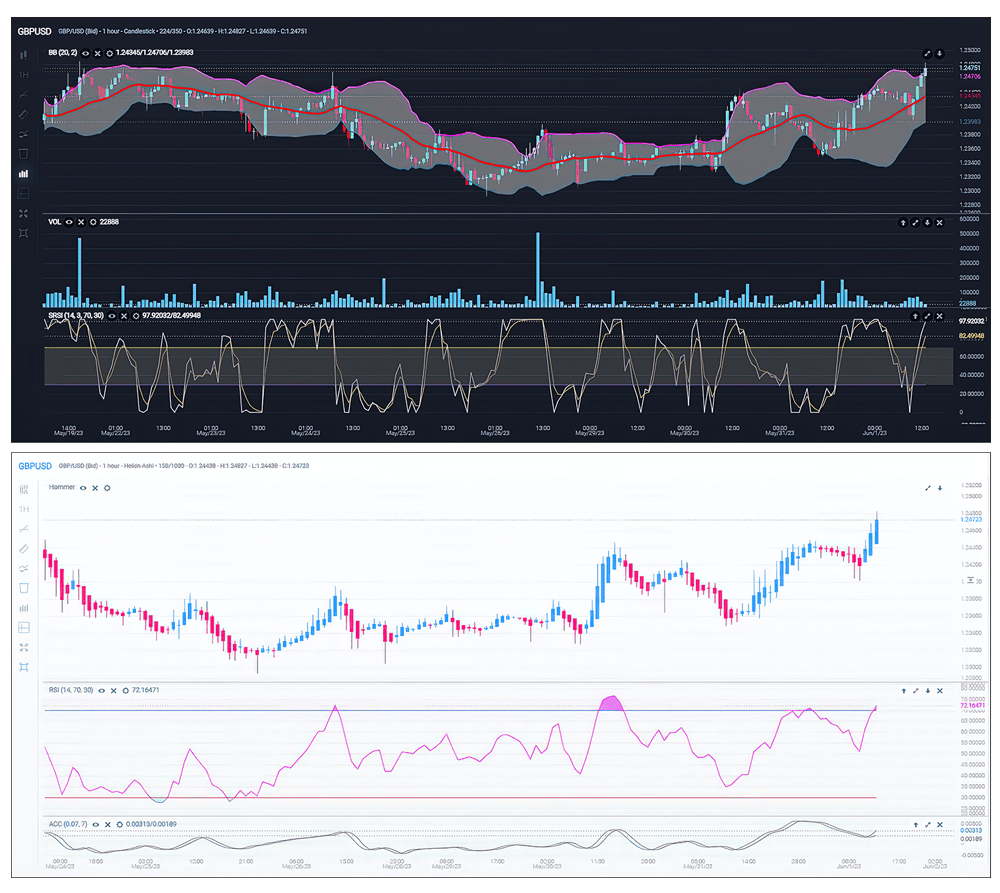
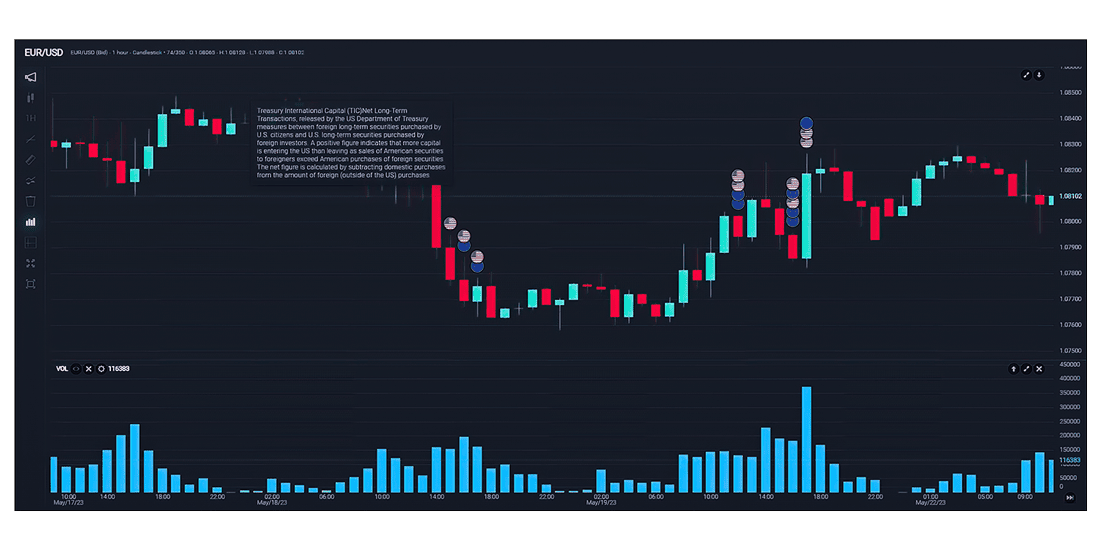
Harness the power of real-time data, multiple chart types, and an extensive array of technical indicators. Their unrivaled capabilities support your team in conducting comprehensive market analysis
Elevate your platform with cutting-edge charting solutions by seamlessly integrating your own market data sources and adding value without requiring extensive infrastructure changes.
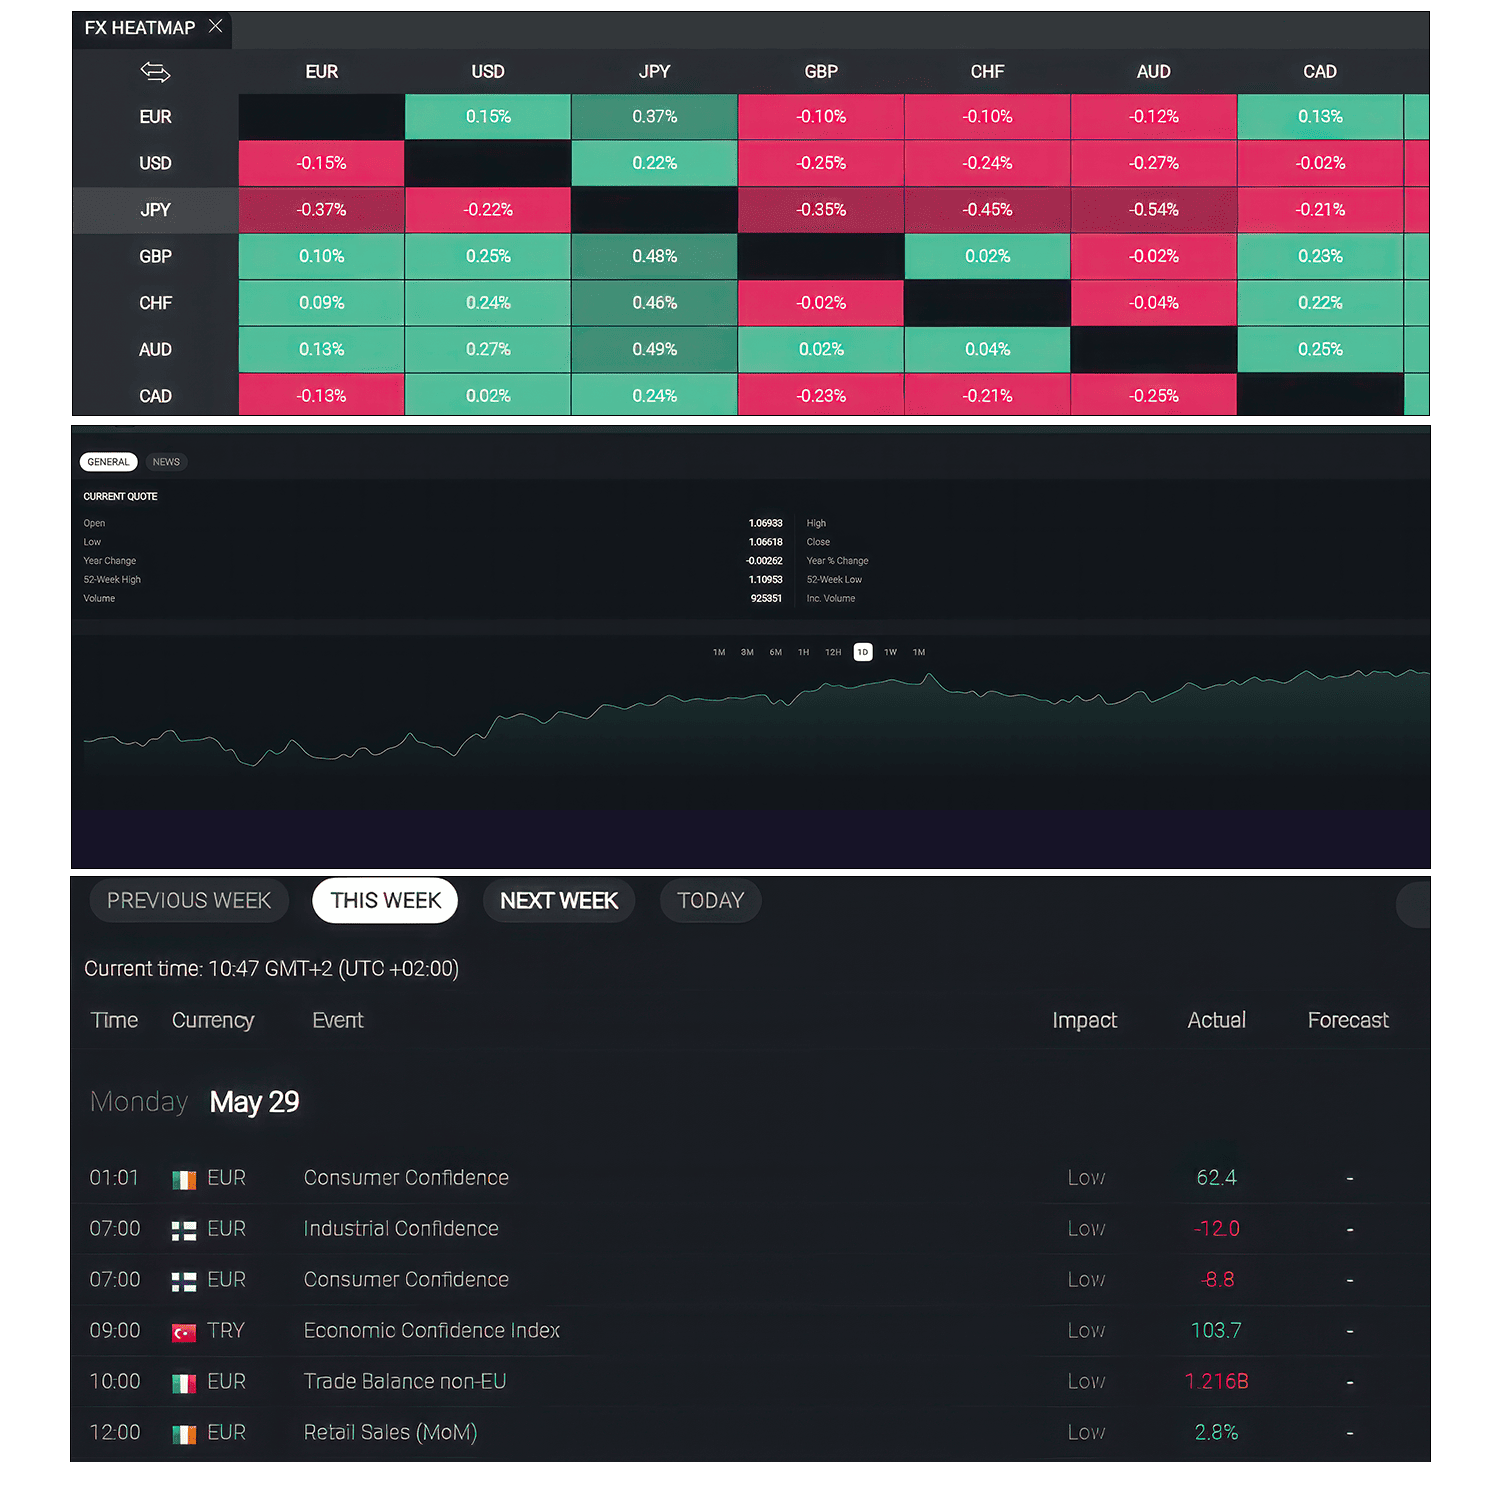
Designed to give you focused insights into various aspects of the market data, Netdania’s engaging and customisable widgets deliver clear and concise information at hand, to drive informed decisions.
Tailor Netdania’s data visualisation tools to your firm’s unique requirements by leveraging Netdania’s team of experts to build bespoke solutions, fine-tuned and adapted to your evolving needs.