Introducing Social Charts: Shareable, dynamic, and interactive
Any bank who has ever tried to send a technical analysis to a client understands the struggle of keeping the dialogue engaging and the conversation flowing. First of all, how do you forward a chart to a client? A screenshot? A PDF? And once your client has actually received the chart, there’s no way they can see your predictions unfold because you just shared a static image with them.
We’re proud to present a solution to that problem: Social Charts by NetDania.
Welcome Social Charts - charts for the future
United Fintech is pleased to announce that a new product from NetDania, one of our portfolio companies, has just seen the light of day. We’re incredibly proud to bid welcome to Social Charts, a completely new, interactive kind of charting that will help banks engage in conversation with their customers and spread the word of their trading research to online communities.
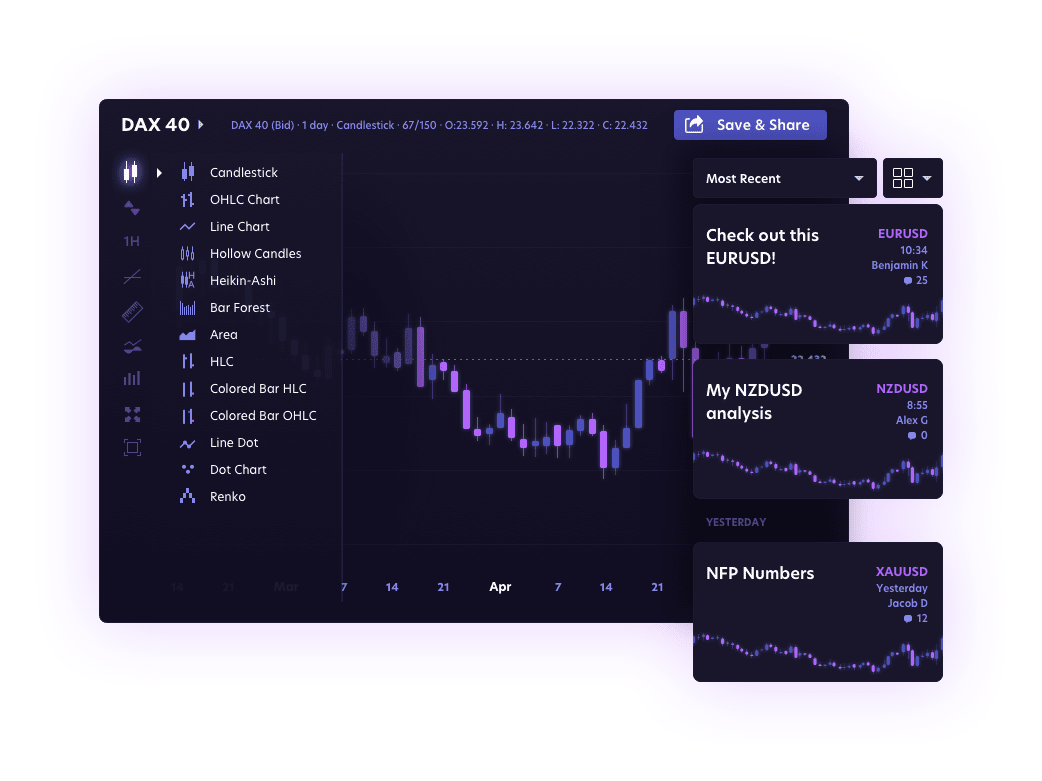
What is Social Charts?
NetDania has long been a leader in providing best-in-class charting solutions to enterprises that work both on web, desktop, and mobile setups. Social Charts has all of the technical performance aspects and extensive features that users of NetDania’s Charts rely on, but with added interaction that will create more engagement both internally and externally.
Here’s a quick overview of what Social Charts can do:
- Fully white-labeled: Integrate into your own enterprise network easily
- Social sharing: Gain a foothold in online communities by sharing trading research
- Agile setup: Almost no onboarding, just a few lines of code
- Interactive: Press play and watch your chart predictions unfold
We’ll include a description of each of the functionalities in this article if you want a more extensive explanation.

Who’s it for?
Social Charts are a completely new way of interacting with chart predictions. But it’s much more than that - it’s also a completely new way of interacting with your clients.
If you’re a financial institution, Social Charts will finally enable you to send a chart that is dynamic, interactive, and shareable. Send it to your clients in a controlled, enterprise environment to engage them in conversation with you, or spread the word to online communities. The choice is yours.
Take a look at this page for more information on Social Charts or sign up for a free demo today!
The functionalities explained
In this section, we’ll dive into the functionalities of Social Charts and why they make this product so unique.
Fully white-labeled
The ability to share chart predictions and research on social media is not appealing to all of our clients. Social Charts is a fully white-labeled solution that can be set up in an internal environment where you control where your chart research gets shared and reshared.
We can create a fully white-labeled setup, set to match your brand, where you stay in control of what’s being shared and reshared at all times. You still get all of the benefits of an online community, but this time it’s an online community that you’re in control of.
Utilize our open API framework for charting to integrate Social Charts into your community.
Social sharing
We know that many of our financial institution clients cater to retail investors who frequent online communities and use them to share many of their investment decisions. Why not enter the discussion with your own chart research or let your users share content from your platform? Doing so will direct traffic to your site and create a buzz around your brand.
Agile setup
Many charting solutions require months of onboarding and countless IT hours allocated to get the system up and running. That’s one of the reasons many financial institutions shy away from choosing a charting provider. Not Social Charts, however.
Implement Social Charts in your systems and websites with just a few snippets of code (seriously!) utilize our open API framework for agile setup.
Interactive
Everyone who’s dealt with charts has had to send a screenshot at some point, simply because there was no other way to share. Social Charts will put an end to that.
Whether you keep Social Charts in a white-label environment or choose to share your chart research on social media, the charts stay interactive and dynamic. Use the many drawing tools and technical analysis to draw up your predictions, send your charts, and let people press play to watch your chart predictions unfold from the time of creation to the moment of opening.
.png)


Heading
We turn bold ideas into measurable results. By combining insight, execution, and technology, we deliver solutions that make transformation not just achievable, but repeatable.


